1. Examples of cost-effectiveness analysis
A medicine or medical device is sometime applicable for various diseases. For example, the anticancer drug “oxaliplatin” is indicated for 5 other diseases, including gastric and colorectal cancer.
In the cost-effectiveness analysis, on the other hand, analysis is conducted for each disease, as a rule. This is because the ICER varies from disease to disease even for the same medicine/medical device. In addition, if medicine or medical device is known to be effective for only patients with a certain disease with a particular gene (ineffective for patients without the same gene), analysis is conducted for each patient group.
Therefore, when discussing the results of cost-effectiveness analysis, we need to carefully consider which disease or subgroup was covered.
In the cost-effectiveness analysis, the comparator is also important. Cost effectiveness is determined only by comparison with a control. As the cost-effectiveness would vary depending on the comparator, selection of appropriate comparator is important.
2. How to interpret the analysis
In academic journals, result of cost-effectiveness analysis is often represented as shown below (the numerals are artificial ones).
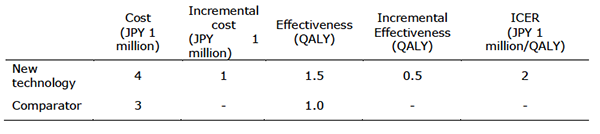
This table should be read from the left to the right. First, let us view the row of “cost.” It shows that treatment using new technology would require JPY 4 million.
This does not mean that treatment with this technology would actually cost JPY 4 million in all cases. Furthermore, since this amount would vary depending on time horizon of analysis. Thus, this figure cannot be simply applied by a given patient for his/her treatment.
The cost of comparator is estimated as JPY 3 million. This indicates that new technology costs JPY 1 million more. This is described in the row of “incremental cost.”
As far as outcome is concerned, new treatment yields 1.5 QALY on average, in contrast to 1 QALY yielded by the comparator. This means that use of new technology is associated with “incremental effectiveness” by 0.5 QALY. However, care is needed, because this is not applicable to purposes such as prediction of the prognosis of a given patient, similar with cost of treatment.
What is shown last is “incremental cost effectiveness ratio (ICER)” obtained by dividing the incremental cost by the incremental effectiveness. The calculation has been performed as follows; ICER = JPY 1 million /0.5 QALY= JPY 2 million. This indicates that treatment with new treatment requires an additional JPY 2 million to gain 1 QALY. If this value is sufficiently small, new technology is judged to be cost-effective, and if it is too large, it is not cost-effective. Actual criteria for judging cost-effectiveness are given later.